Megan, from Austin
Complete Kit · 15 Chapters + 2 Bonuses
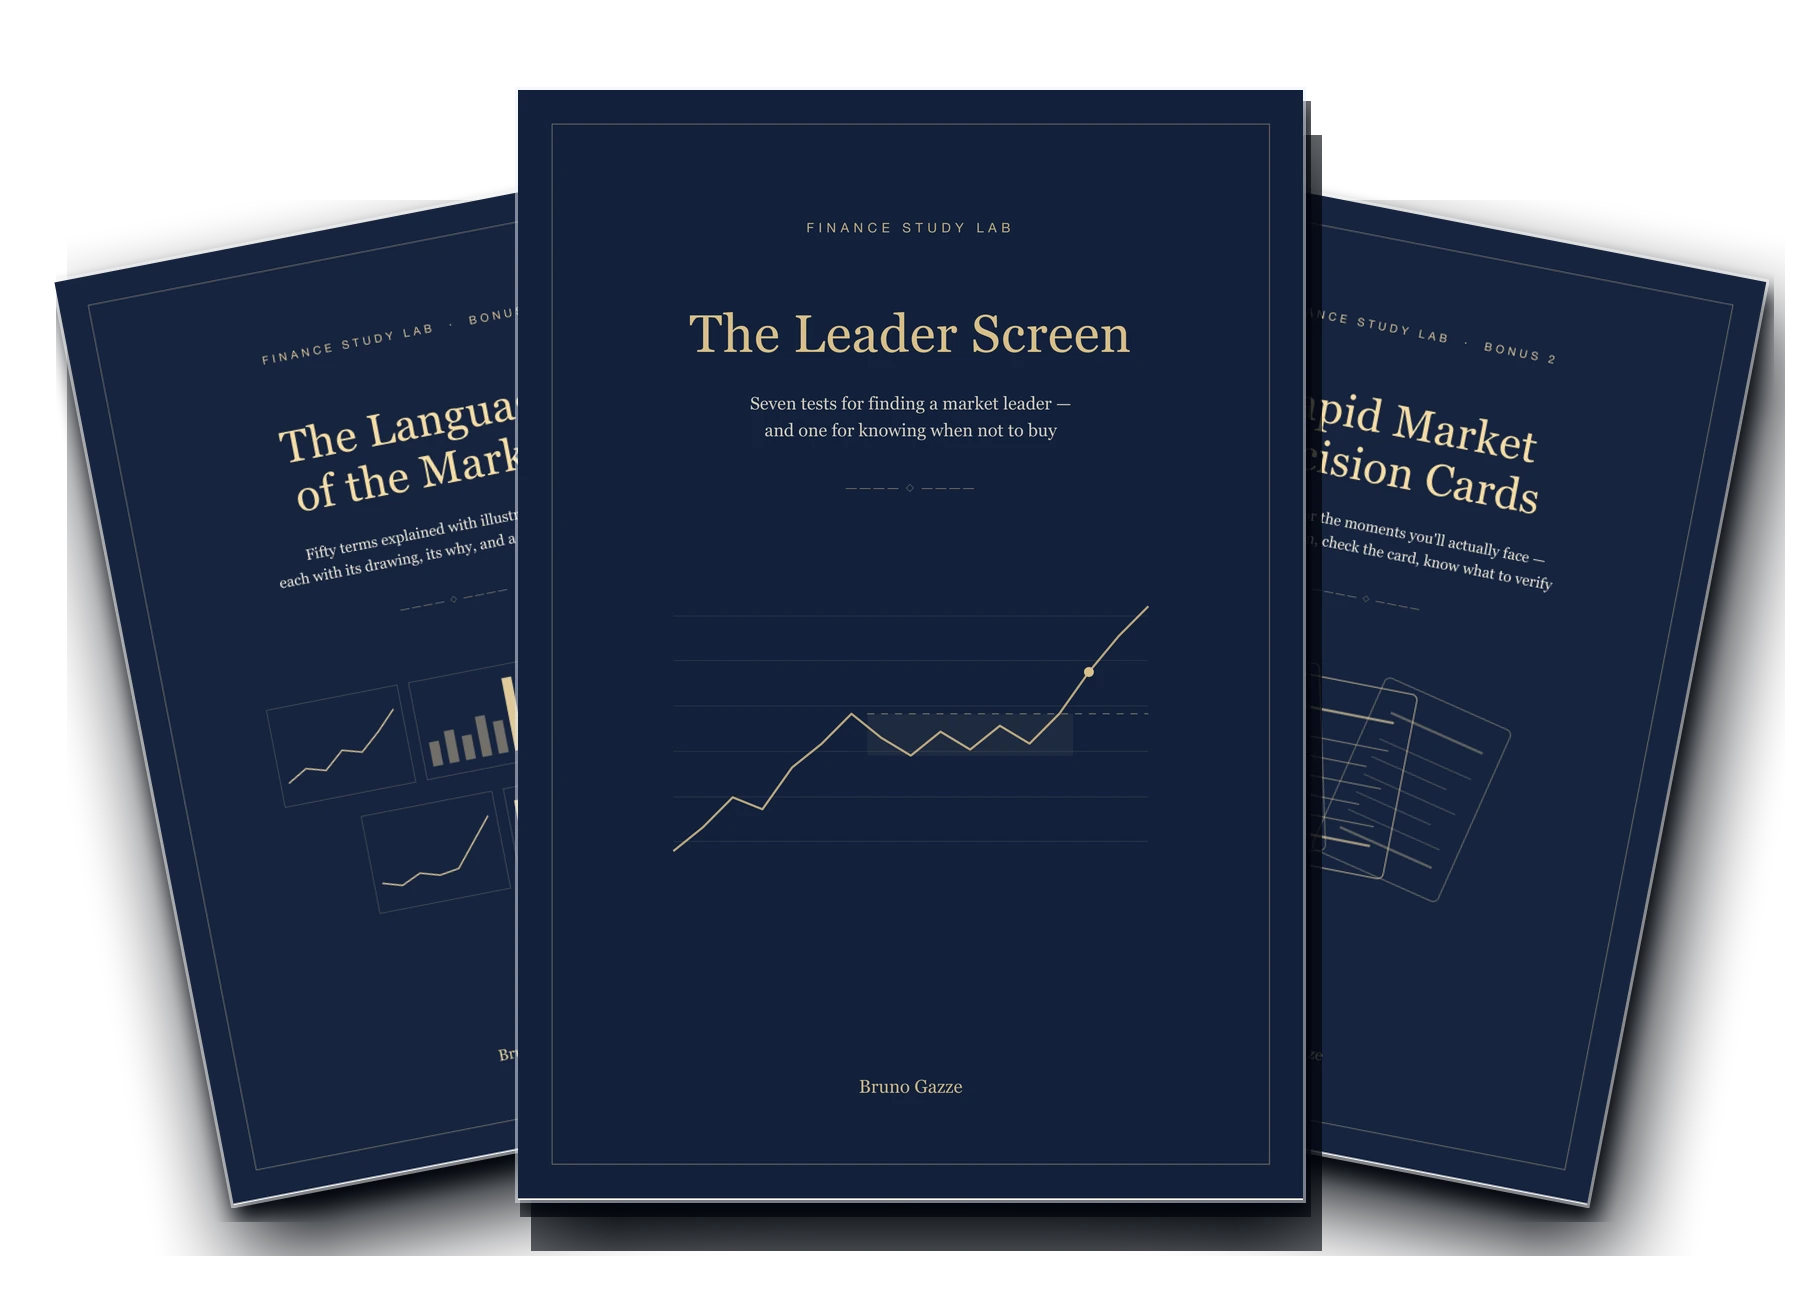
The illustrated system for spotting growth stocks before the crowd explains them — seven tests, one chapter each, in plain English.
I WANT TO READ THE MARKETSecure payment · Instant access · 30-day no-questions guarantee
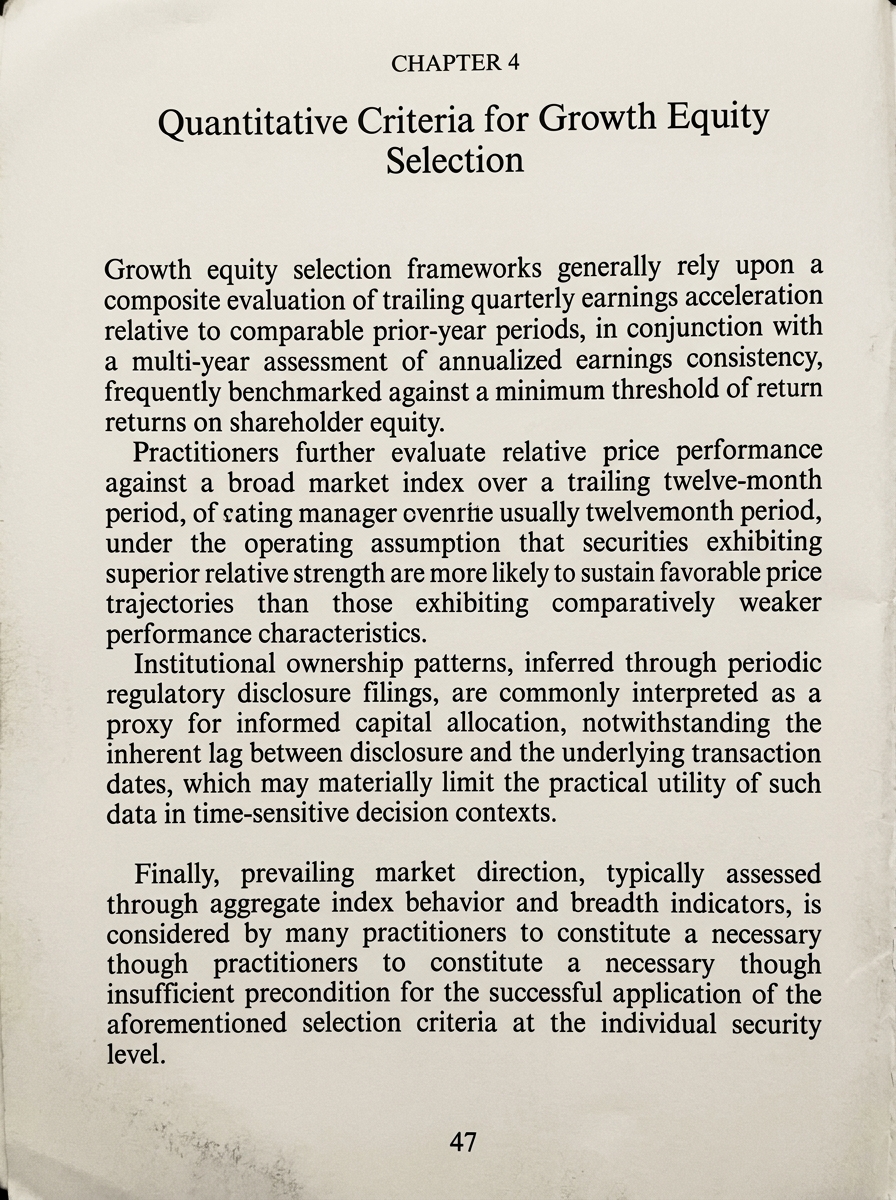
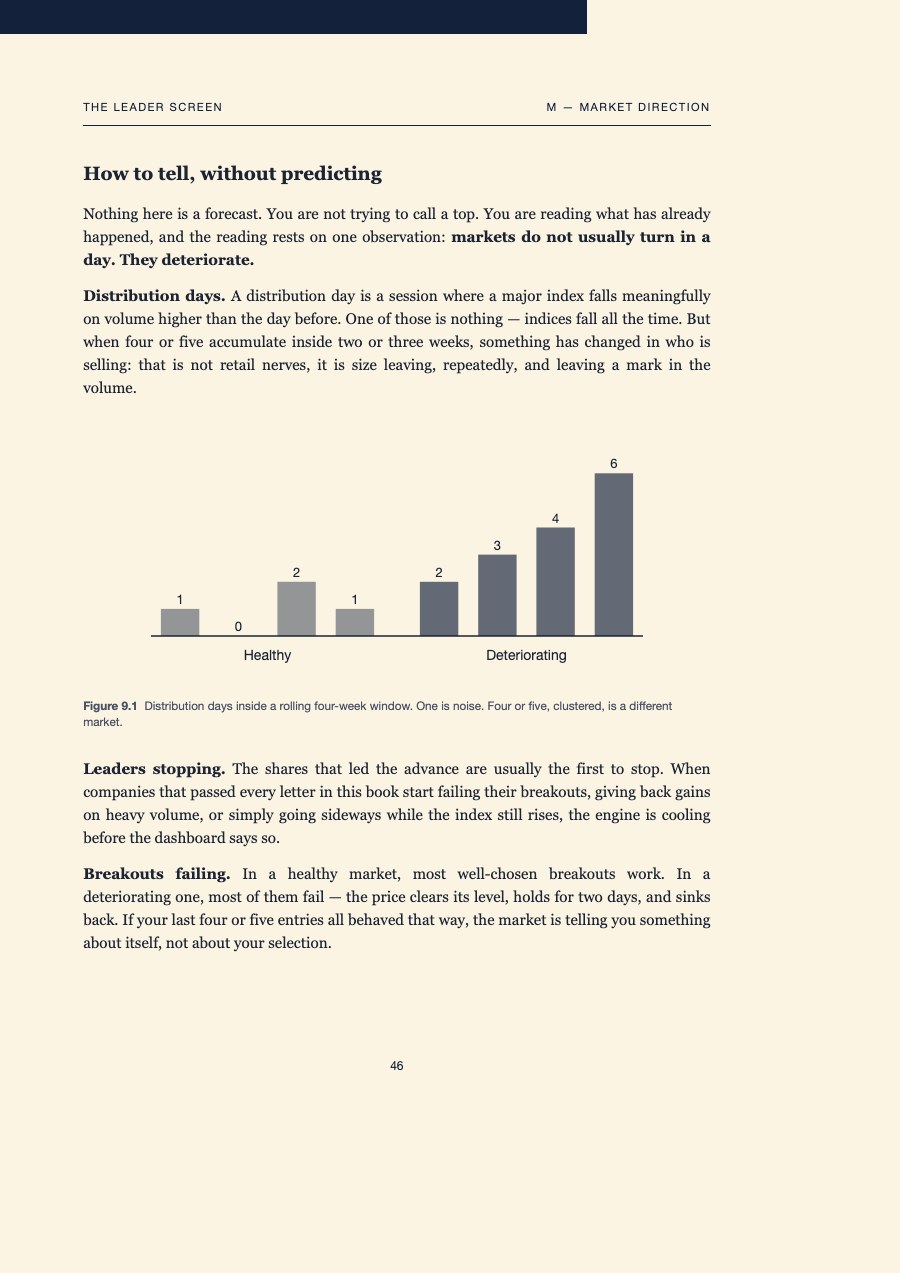
Real pages from the book — direct language, visual organization, and diagrams that stick. Tap one to see it full size:
"The M chapter finally explained why I kept getting stopped out even when my stock picks were 'right.' I was fighting the market, not reading it."
"I used to just say 'earnings looked good' without knowing what to actually check. Now I can walk through C-A-N-S-L-I-M out loud and it holds up."
"I stopped buying 'cheap' stocks that were actually just weak. The Stage Analysis chapter is the reason I finally understand the difference."
"Volume on the breakout was the missing piece. I'd seen the pattern for months without knowing what was actually supposed to confirm it."
"The chapter on cutting losses fast is the one I needed a year ago. I finally have a rule instead of a feeling."
"My finance professor covers WACC, not why a stock actually breaks out on volume. This filled in exactly the gap between the two."
"I kept Googling 'relative strength' and 'distribution day' mid-chapter and losing my train of thought. Having them explained with a picture next to each one changed that."
"The Anti-Watchlist card is basically taped to the inside of my brain now. I check it before I let myself buy anything."
"I'd been staring at chart patterns for a year with zero framework. Now I actually know what I'm looking for before I open a chart."
"Bought this for my son before his finance internship interview. He actually used the CAN SLIM answer in his second round."
"My roommate left this open on the kitchen table and I ended up reading the whole M chapter before I bought my own copy."
"Nobody in my program ever explained market regime. I was picking great stocks in a market that was already rolling over."
"I went from copying setups I saw online to actually being able to explain why I'd take -- or skip -- a trade."
"I have ADHD and most trading content loses me after two paragraphs. The illustrated pages actually kept me reading to the end."
"I run a small business and always figured this stuff was for people who already worked in finance. Turns out I just needed it explained properly."
"Left a finance-adjacent job to become a teacher and realized I understood spreadsheets but never actually knew how to read a chart. Ironic, but this fixed it."
"I panic-sold in 2022 and regretted it within six months. Stage Analysis is basically the conversation I wish someone had had with me first."
"Position sizing sounded like something only professionals did the math for. Now I actually run the numbers before I enter."
"I'm 58 and only started reading charts this year. Nobody made me feel like I was too late or too old for this."
"I always figured trading was just gambling with extra steps. Seeing the actual selection criteria laid out changed my mind completely."
"Wish this existed when I graduated. Would have saved me at least two years of trading on vibes instead of a system."
These reviews illustrate the style of feedback you'll be collecting — swap them for real reader reviews as soon as you have them.
From strength to structure to execution — all illustrated, all practical
Picture this:
Instead of re-reading the same paragraph on relative strength five times trying to figure out if a breakout is actually real...
...you open 1 illustrated page that shows you exactly what to check, in one glance.
Your brain sees the whole mechanism at once. The connections form on their own. And you finally know why a threshold matters, instead of copying a setup you saw online without knowing why it worked.
That's exactly what the Finance Study Lab Kit does.
It isn't “just another PDF”. It's the system that organizes everything you already half-know (and everything your classes skipped) into 15 illustrated chapters, built so your brain understands instead of guesses.
Because once you can see the mechanism, the checklist starts running itself.
How to use the book, the gap between knowing and doing, and what a market leader actually looks like once you strip the romance out of it.
Current quarterly earnings and the three-year record. The two arithmetic letters: what counts as growth, and what only looks like it.
Something new, supply and demand, leader or laggard, and who is actually buying. The letters with no calculator and the most expensive instincts.
The letter that overrides the other six, and the only one that does. Counting distribution days, and stopping when the count says stop.
Bases and breakouts, the 7 % stop and the 20 % cap. Where good analysis still ends badly, and the arithmetic that makes it non-negotiable.
The Sunday night workflow, an honest chapter on what this system is bad at, plus the glossary, sources, scorecard template and the Texas–Florida lens.
Optional · after checkout
The book teaches the method. The Weekly Screen runs it for you, every Sunday.
Named companies, what is forming, what broke down, and my own read on it — not a digest of headlines. $9 a month, offered once after you check out, cancel in one click. See what is in it ↓
Plus: The Trader's Mind (probabilistic thinking, discipline and execution) and, to close, a glossary, sources and a full index.
Individual value: $19
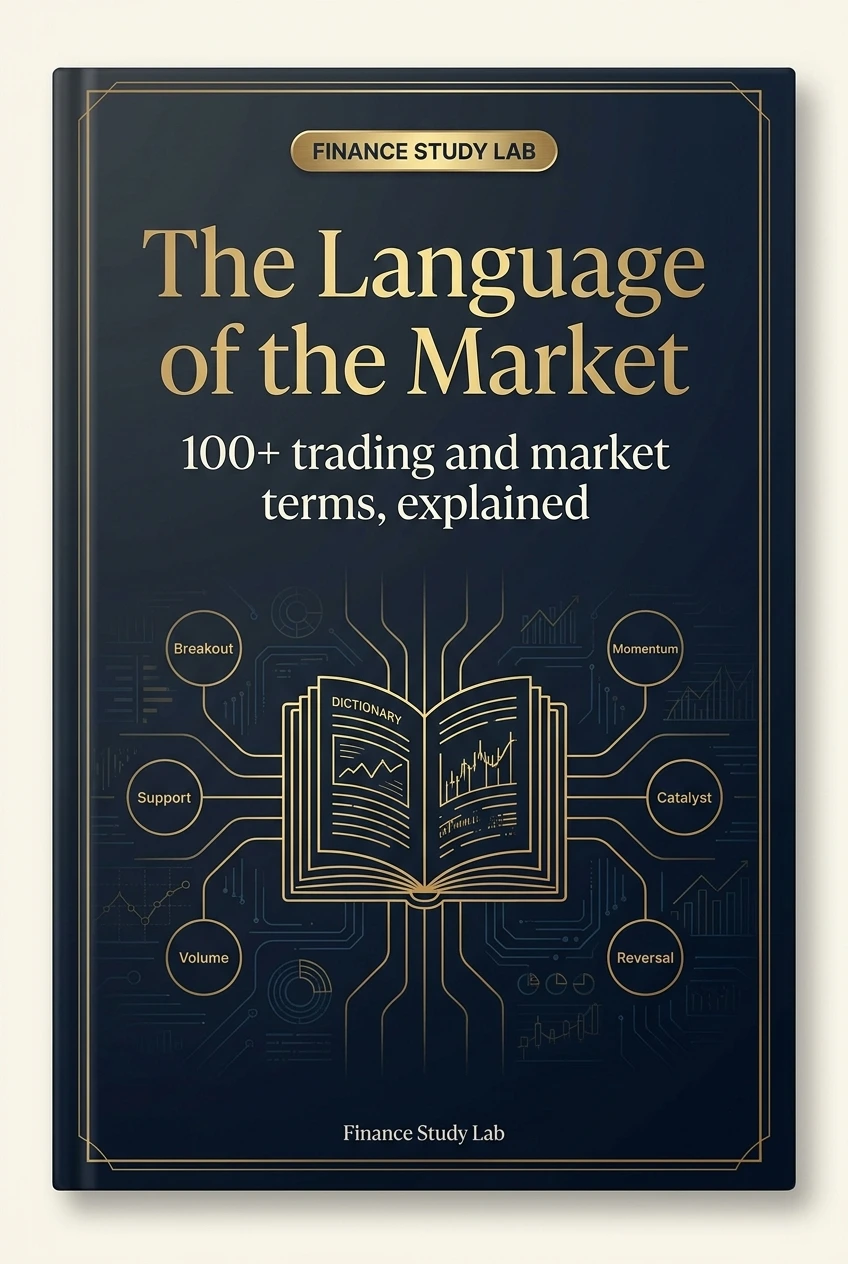
Every term with its own drawing, its “why”, and a plain-English example — from float and relative strength to distribution days and accumulation. Stop nodding along and start knowing exactly what a term means the moment you read it.
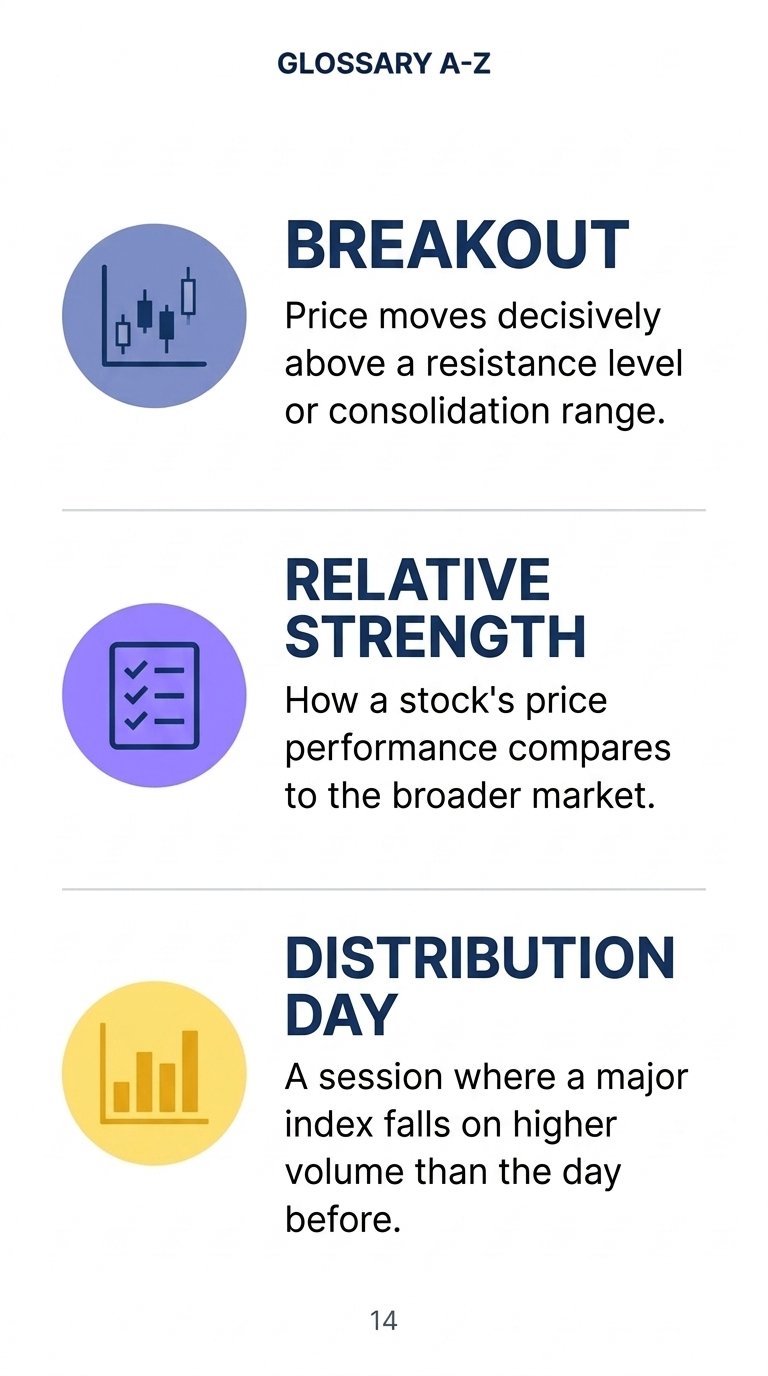
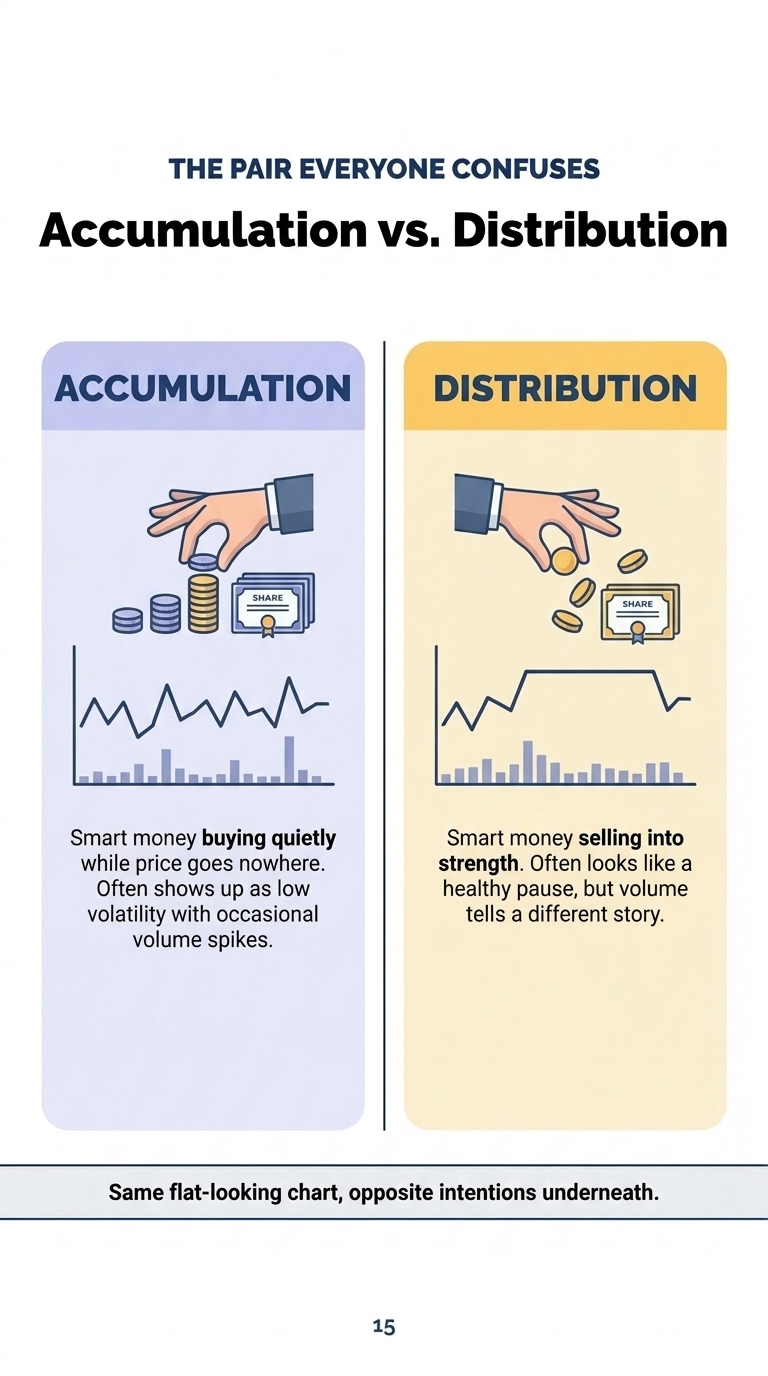

Individual value: $19
These 5 categories cover the decisions that actually cost students money. Read the situation, check the card, know what to verify before you act.
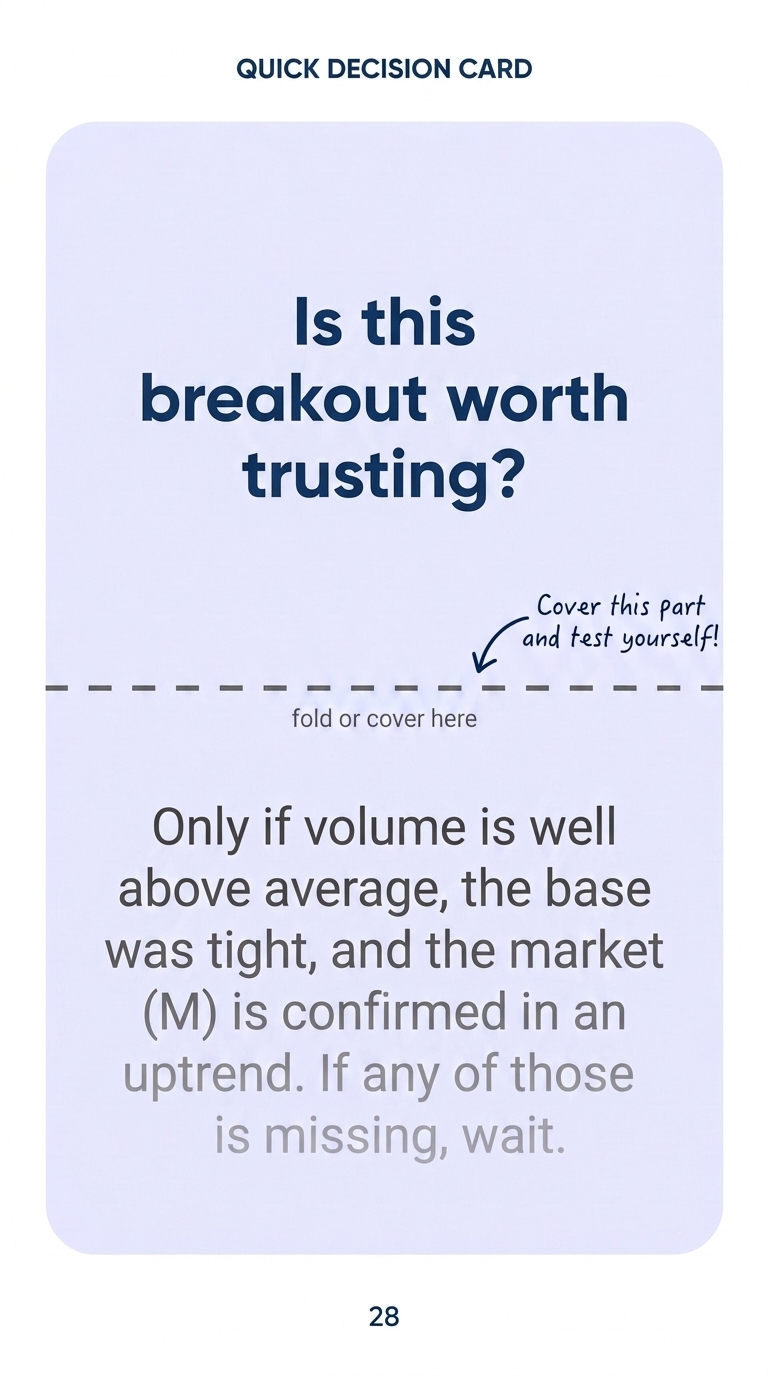
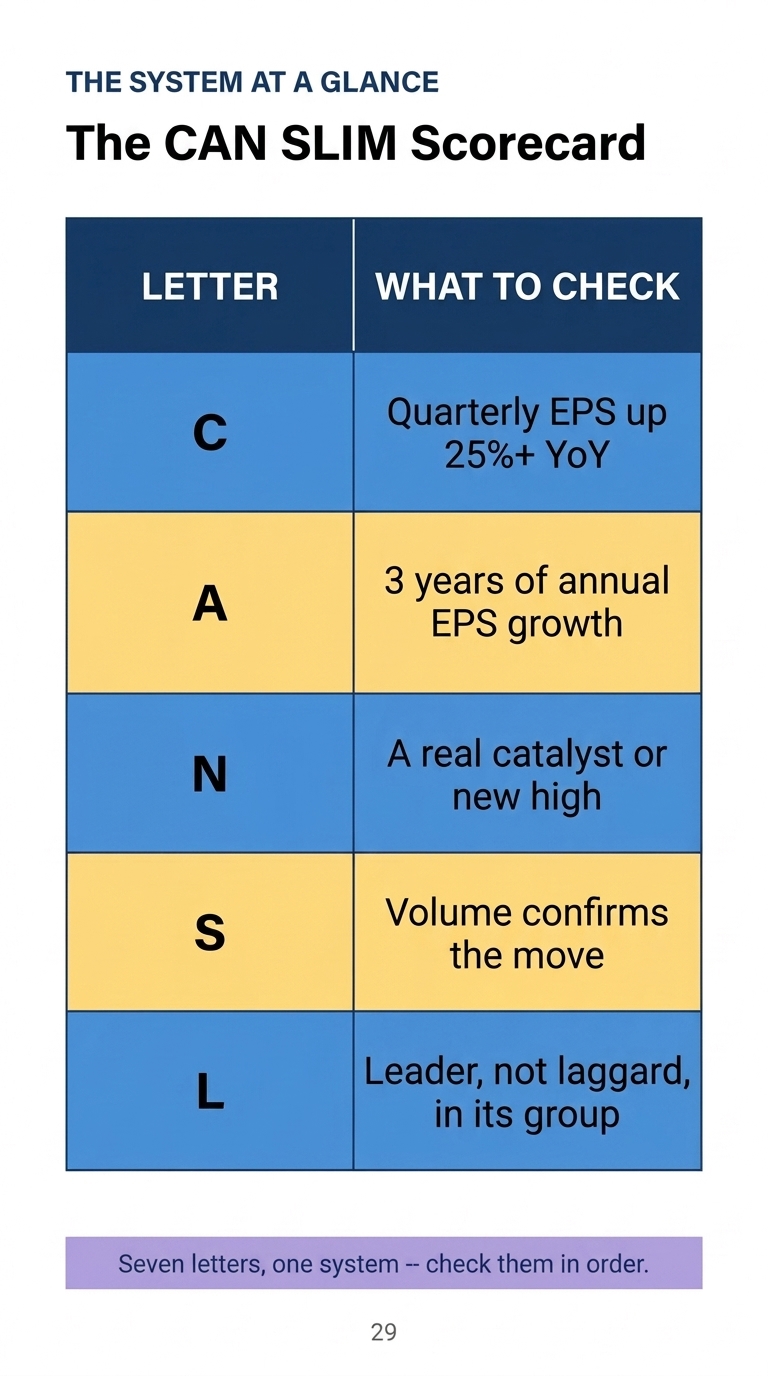
Total value: $105
Today only:
$17
SAVE $88One-off payment, no installments, no hidden fees.
Every Sunday, the same seven tests applied to what the market actually did that week — so you are not starting from a blank screen on Monday.
It is not a newsletter. It is a read: specific companies, named; what is forming and what broke down; and what I make of it, said plainly, with the reasoning shown instead of hidden.
$9 a month. Cancel in one click, from a link at the bottom of every issue.
Buyers of the book keep this price for as long as they stay subscribed.

Your classes cover statements, WACC and DCF, but never why a stock actually breaks out on volume. You want the gap between classroom finance and desk-level reading closed, properly, before your next interview or your next trade.

You've been trading for a while, copying setups you saw online without fully knowing why they worked or when to sit out. You want a real system — thresholds, not vibes — and the discipline to know when NOT to trade.

You want to sound like someone who belongs on a desk — able to explain how you'd screen a growth name, not just recite definitions. You want real understanding, not another 60-second video that leaves you more confused.
This is not for you if you're looking for daily signals, options lotto plays, or a promise of guaranteed returns. Finance Study Lab teaches a selection and timing framework — not a shortcut.
$105
$17
I understand you've probably already tried other ways of "figuring out how to read a chart" that didn't stick.
That's why I'm giving you 30 full days to try the Finance Study Lab Kit.
If within that time you feel the material didn't help, wasn't useful, or simply wasn't what you expected, I'll refund 100% of what you paid.
No questions asked. No small print. No hassle.
The risk is ZERO. The decision is yours.
As soon as you complete your purchase you'll get an automatic email with the access link. It's high-resolution PDF, ready to download, print or read on any device.
One-off payment of $17. No installments, no recurring charges, no surprises. Pay once and the material is yours for good.
Neither. Finance Study Lab is educational content that explains how growth-stock selection and timing frameworks work, in plain English. It is not personalized financial, investment, tax or legal advice, and it does not recommend specific stocks. The CAN SLIM framework was developed by William J. O'Neil; this is an independent educational interpretation and is not affiliated with, endorsed by, or sponsored by William O'Neil + Co., IBD, or MarketSurge. Always consider talking to a licensed financial advisor for advice specific to your situation.
You should know the basics — what a stock is, what a chart shows. This isn't a "what is a brokerage account" guide; it teaches the system for selecting and timing growth stocks, the part most finance classes and beginner guides skip.
No, and be wary of anything that claims it does. This teaches you what to look at, in what order, and when not to act — a process, not a promise. Investing involves risk, including loss of principal.
Yes, with no limits. The PDFs are designed in high resolution, ideal for printing, annotating, or using as a quick reference.
Reading a chart doesn't have to feel like a guess.
You don't have to keep copying setups you saw online without knowing why they worked.
You don't have to freeze the moment someone asks you to explain your thesis on a stock.
And you definitely shouldn't stay on the sidelines because nobody ever explained the system properly.
There's a simpler way. And it's one click away.
Over 3,200 students have already chosen to read the market with Finance Study Lab.
Now it's your turn.
You'll receive the material by email in under 2 minutes